|

Excerpts
from The National Health Survey Report, page II-52-53
About
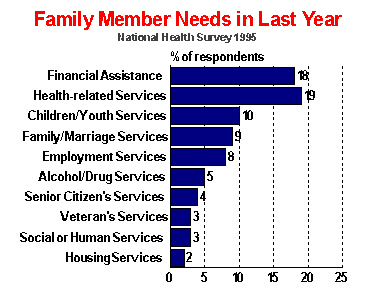
one in five U.S. residents indicated that they or
a member of their family had a need for financial
assistance (18%) or health-related services (19%)
in the last 12 months. Approximately one in ten respondents
indicated that they or a member of had a need for
children and youth services (10%), family and marriage
related services (9%), or employment services (8%)
in the last 12 months. About one in twenty or fewer
U.S. residents indicated a need for alcohol/drug abuse
services (5%), senior citizen's services (4%), veteran's
services (3%), social or human services (3%), or housing
services (2%) in the last 12 months. (Chart 119) U.S.
residents under age 45 were more likely than those
age 45 or older to report that they or a family member
had a need for children and youth services in the
last 12 months (18-34=18%, 35-44=15% vs. 45-64=6%
and 65+=1%). U.S. residents age 65 or older were more
likely than their younger counterparts to report having
a need for health-related services (31% vs. 18-34=16%,
35-44=16%, 45-64=17%). U.S. residents with poverty
level income were more likely than those with low
or above low incomes to report having a need for employment
services (22% vs. 10% and 6%). U.S. residents with
children under six were more likely than those with
no children under six to report a need for children
and youth services (30% vs. 6%). Nonwhites were more
likely than whites to have a need for employment services
in the last 12 months (18% vs. 6%). U.S. residents
were also asked whether they or a family member had
used specific services in the last 12 months. About
one in five U.S. residents indicated that they or
a member of their family had used financial assistance
(17%) or health-related services (18%) in the last
12 months. Approximately one in ten respondents indicated
that they or a member of used children and youth services
(8%) and family and marriage related services (8%)
in the last 12 months. About one in twenty or fewer
U.S. residents indicated used employment services
(6%), alcohol/drug abuse services (3%), senior citizen's
services (3%), veteran's services (3%), social or
human services (2%), or housing services (2%) in the
last 12 months.
See
More Data?
National
Health Survey Intoduction Page
|